Economic Update

Institute for Supply Management (ISM) Manufacturing Report on Business:
Economic activity in the manufacturing sector bounced back in July.
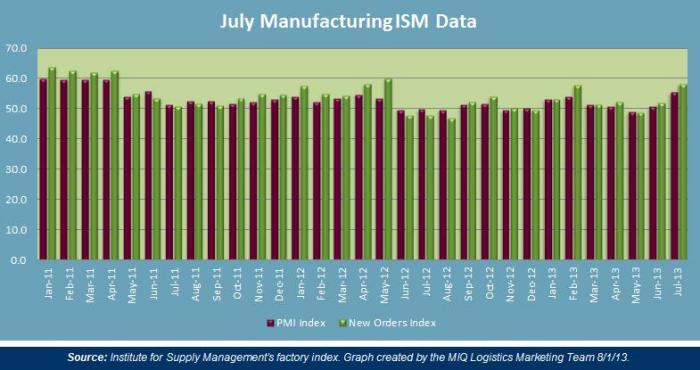
- 50 represents the dividing line between expansion and contraction for the index of the below chart; which covers the Purchasing Managers Index (PMI) and new orders.
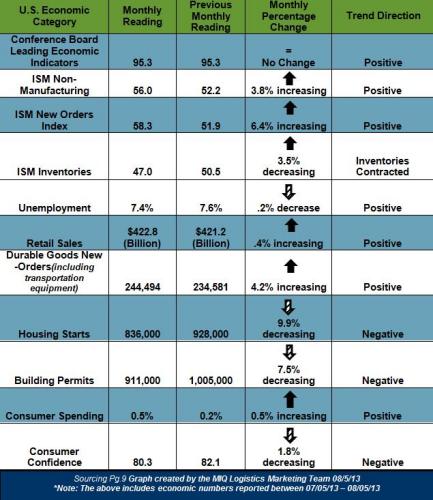
- The PMI reading increased to 55.4% in July, which is 4.5 percentage points higher than June’s reading of 50%.
- New Orders increased in July by 6.4% to reach 58.3% on the index.

Expanding Manufacturing Industries
- Furniture & Related Products
- Textile Mills
- Printing & Related Support Activities
- Paper Products
- Wood Products
- Nonmetallic Mineral Products
- Electrical Equipment, Appliances & Components
- Computer & Electronic Components
- Food, Beverage & Tobacco Products
- Primary Metals
- Transportation Equipment
- Chemical Products
- Fabricated Metal Products
Contracting Manufacturing Industries
- Plastics & Rubber Products
- Apparel, Leather & Allied Products
- Machinery
- Miscellaneous Manufacturing
Transportation Market Update

U.S. Fuel Forecast: Recent statements from the “Short Term Energy Forecast” (07/09/13)
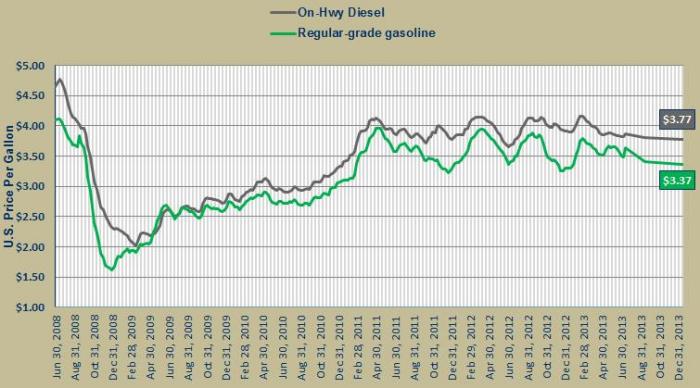
- “EIA’s projection, as of July 9, 2013, for the average retail price of on-highway diesel fuel for July through December 2013 is $3.81 per gallon. The projection for the average retail price in 2014 is $3.77 per gallon”.
- “EIA expects the annual average regular gasoline retail price to decline from $3.63 per gallon in 2012 to $3.48 per gallon in 2013 and to $3.37 per gallon in 2014.”
- “Since reaching 12.5 million bbl/d in 2005, total U.S. liquid fuel net imports including crude oil and petroleum products, have been falling. Total net imports fell to 7.4 million bbl/d in 2012, and EIA expects net imports to declining to an average of 5.7 million bbl/d by 2014. Similarly, the share of total U.S. consumption met by liquid fuel net imports peaked at more than 60 percent in 2005 and fell to an average of 40 percent in 2012. EIA expects the net import share to fall to continue to fall to 31 percent in 2014, which would be the lowest level since 1985.”
Monthly Transportation Indexes
| Truckload Index Category | Monthly Reading | Previous Monthly Reading | Trend Direction |
| American Trucking Association (SA) seasonally adjusted For-Hire Truck tonnage | 125.9 | 125.8 | + 0.1% increasing |
| Cass Freight Index Report (Shipments) | 1.107 | 1.133 | – 2.3% decreasing |
| Cass Freight Index Report (Expenditures) | 2.484 | 2.463 | + .09% increasing |
| Freight Transportation Services Index | 114.3 | 113.1 | + 1.2% increasing |
| NAFTA | $98.6 billion | $98.9 billion | – 0.2% decreasing |
| Trucking Employment | + 6,300 jobs | – 3,000 jobs | + 2.3% Increasing (YOY) |
“The fact that tonnage didn’t fall back after the 2.1% surge in May is quite remarkable,” ATA Chief Economist Bob Costello said. “While housing starts were down in June, tonnage was buoyed by other areas like auto production which was very strong in June and durable-goods output, which increased 0.5% during the month according to the Federal Reserve.” “Robust auto sales also helped push retail sales higher, helping tonnage in June” he said, “The trend this year is heavy freight, like autos and energy production, is growing faster than lighter freight, which is pushing turck tonnage up.”
Global Market Update

Global Port Tracker expecting gains in import volumes between May and August
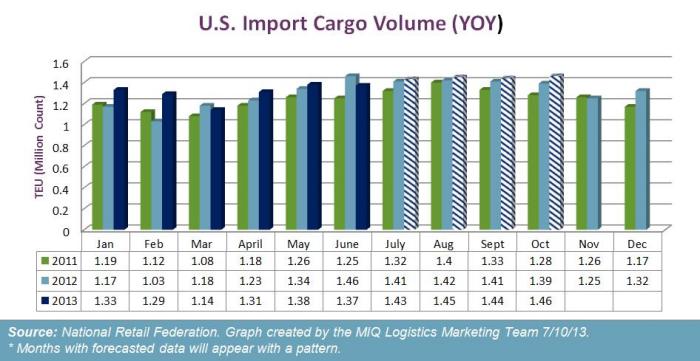
- April which was the last month for which Global Port Tracker has confirmed data; shows that 1.31 million TEU were imported to the U.S. This figure is up 14.6% month-over-month.
- May – September are all expected to see YOY percentage increases, but nothing greater than 2.2%.
- “We are witnessing a period of import trade growth that is running more or less in sync with the U.S. economic expansion. Unfortunately, both are anemic,” – Hackett Associates Founder Ben Hackett.
Peak Season Surcharge 8/1/13:
| Container Type | 20′ | 40′ | 40′ HC | 45″ |
|---|---|---|---|---|
| TPEB Lanes | $320.00 | $400.00 | $450.00 | $506.00 |
*Note: The Peak Season Surcharge (PSS) charge above; while implemented by carriers on 8/1/13, the actual PSS amounts are at mitigated levels.
GRI TransPacific Eastbound 09/01/13:
| Container Type | 20′ | 40′ | 40’HC | 45′ |
| U.S. West Coast | $320.00 | $400.00 | $450.00 | $505.00 |
| IPI / AWS | $480.00 | $600.00 | $675.00 | $760.00 |
SOURCES
Domestic & Global Economy
- “Employment Situation Summary”– www.bls.gov 08/02/13
- “July 2013 Manufacturing ISM Report on Business”– www.ism.ws 08/01/13
- “July 2013 Non-Manufacturing ISM Report on Business”– www.ism.ws 08/05/13
- “U.S. Consumer Spending, Inflation Rise in June”– www.reuters.com 08/02/13
- “Consumer Confidence Index in U.S. Fell to 80.3 in July”– www.bloomberg.com 07/30/13
- “Advance Monthly Sales For Retail And Food Service”– www.census.gov 07/15/13
- “Advance Report on Durable Goods Manufacturers’ Shipments, Inventories and Orders June 2013”– www.census.gov07/25/13
- “June Retail Sales Indicate a Growing but Measured Economy”– nrf.com 07/15/13
- “New Residential Construction In June 2013”– www.census.gov 07/17/13
- “Decrease in Starts Curbs U.S. Housing Rebound: Economy”– www.bloomberg.com 07/17/13
- “Consumer Sentiment in U.S. Increases to Six-Year High July” –www.bloomberg.com07/26/13
- “The Conference Board Leading Economic Index”– www.conference-board.org07/18/13
U.S. Fuel Forecast
- “Short-Term Energy Outlook (STEO)” – www.eia.gov 07/09/13
Truckload Capacity & Volumes
- “Even with promising signs, Cass Freight report points to an up and down market in June”– www.logisticsmgmt.com 07/03/13
- “Cass Freight Index Report”– www.cassinfo.com – 08/07/13
- “Trucking adds 6,300 jobs in July; U.S. job growth weaker”– www.ccjdigital.com 08/02/13
- “ATA Truck Tonnage Index Rose 0.1% in June”– www.truckline.com 07/23/13
- “Spot Market Freight Moves Higher in May from April”– www.truckinginfo.com 06/17/13
- “BTS reports May 2013 surface trade with NAFTA partners is up 1.8 percent annually”– www.logisticsmgmt.com 07/31/13
- “FTR Trucking Conditions Index in May is in line with previous months”– www.logisticsmgmt.com 07/10/13
Global Market Update
- “Strong Growth in Merchandise Imports to Resume in Fall” – www.nrf.com 07/09/13
- “Port Tracker report says import activity to remain slow in summer months”– www.logisticsmgmt.com 07/10/13
- “2013 Peak Season prospects are mixed, according to LM survey data”– www.logisticsmgmt.com 07/19/13
- “Global trade data is flat in June but should pick up in coming months, says Panjiva”– www.scmr.com 07/19/13
- “Analyst Expect Weak Second Quarter for Container Lines”– www.joc.com 07/22/13
- “Sept. 1 MSC Rate Hike is Second in a Month” – www.joc.com 08/01/13
