Institute for Supply Management (ISM) Manufacturing Report on Business:
Economic activity in the manufacturing sector bounced back in June.
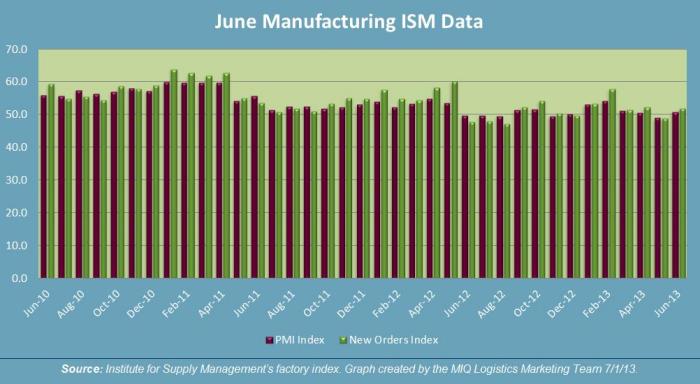
- 50 represents the dividing line between expansion and contraction for the index of the below chart; which covers the Purchasing Managers Index (PMI) and new orders.
- The PMI reading increased to 50.9 in June, from a low in May of 49.0; this is back above the expansion level.
- New Orders decreased in June by 3.1% to reach 51.9 on the index.

Expanding Manufacturing Industries
- Furniture & Related Products
- Apparel, Leather & Allied Products
- Paper Products
- Electrical Equipment Appliances & Components
- Petroleum & Coal Products
- Wood Products
- Food, Beverage & Tobacco Products
- Primary Metals
- Fabricated Metal Products
- Plastics & Rubber Products
- Machinery
- Nonmetallic Mineral Products
Contracting Manufacturing Industries
- Textile Mills
- Transportation Equipment
- Chemical Products
- Computer & Electronic Products
Transportation Market Update

American Trucking Association:
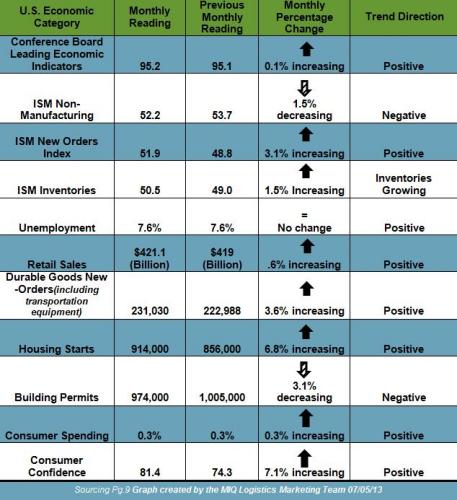
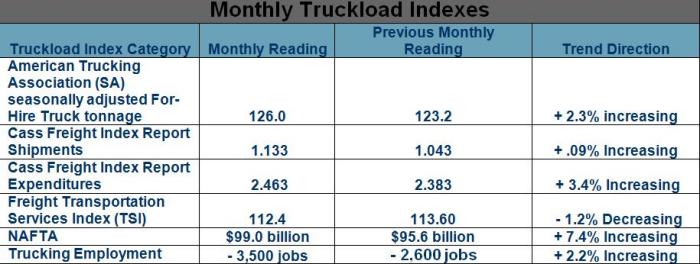
“After bouncing around in a fairly tight band during the previous three months, tonnage skyrocketed in May,” ATA Chief Economist Bob Costello said. Some of the increase is attributable to factory output rising in May for the first time since February (+0.2%) and retail sales performing stronger than expected in May (+0.6%). Costello added, “The 6.8% surge in new housing starts during May obviously pushed tonnage up as home construction generates a significant amount of truck tonnage.”

U.S. Import Container Forecast:
Latest Report from Global Port Tracker shows a 1.2% YOY gain for the first six months of 2013:
- May which was the last month for which Global Port Tracker has confirmed data; shows that 1.38 million TEU were imported into the U.S. This figure is up 1.2% month-over-month increase, and a 0.6% YOY increase.
- June is now forecasted to come in at 1.37 million TEU, which would be a 0.7% decrease YOY.
- “With the economy recovering slowly, retailers have been cautious with imports this summer but it’s clear that they expect an upturn later in the year,” – Jonathan Gold (NRF Vice President for Supply Chain and Customs Policy”.
Global Market Update
Carriers announced Peak Season Levls for Aug 1st for Transpacific Eastbound Lanes. The majority of carriers have announced the following:
| TPEB | 20′ | 40′ | 40′ HC | 45′ |
| ALL | $320.00 | $400.00 | $450.00 | $506.00 |
| 20′ | 40′ | 40′ HC | 45′ | |
|---|---|---|---|---|
| West Coast Ports | $422 | $527 | $593 | $667 |
| Long-Haul IPI | $713 | $891 | $1,002 | $1,128 |
| East Coast Ports | $784 | $980 | $1,103 | $1,241 |
SOURCES
Domestic & Global Economy
- “Employment Situation Summary”– www.bls.gov 07/05/13
- “June 2013 Manufacturing ISM Report on Business”– www.ism.ws 07/01/13
- “June 2013 Non-Manufacturing ISM Report on Business”– www.ism.ws 07/03/13
- “Consumer Spending in U.S. Rebounds as Incomes Increase”– ww.bloomberg.com 06/27/13
- “Advance Monthly Sales For Retail And Food Service”– www.census.gov 06/13/13
- “Advance Report on Durable Goods Manufacturers’ Shipments, Inventories and Orders May 2013”– www.census.gov 06/25/13
- “New Residential Construction in May 2013”– www.census.gov 06/18/13
- “US Consumer Confidence at 5-Year High in June”– www.dailyfinance.com 06/26/13
- “The Conference Board Leading Economic Index”– www.conference-board.org 06/26/13
Truckload Capacity & Volumes:
- “Even with promising signs, Cass Freight report points to an up and down market in June”–www.logisticsmgmt.com 07/03/13
- “Cass Freight Index Report”– www.cassinfo.com – June 2013
- “Trucking sheds 3,500 jobs in June”– www.truckgauge.com 07/05/13
- “ATA Truck Tonnage Index Surged 2.3% in May”– www.truckline.com 06/18/13
- “Spot Market Freight Moves Higher in May from April”– www.truckinginfo.com 06/17/13
- “BTS reports April surface trade with NAFTA partners is up 7.4 percent annually”– www.logisticsmgmt.com 06/26/13
Global Market Update:
- “Port Tracker report says import activity to remain slow in summer months” –www.logisticsmgmt.com 07/10/13
- “Retailers Remain Cautious on Merchandise Imports”– www.nrf.com 06/10/13
- “Retail Sales Up Nearly 5 Percent from Last Year”– www.nrf.com 06/13/13
- “Ocean Carrier Rate Revision Roundup for July 5” – www.joc.com 07/05/13
- “Ocean cargo carriers confident Transpacific rate hikes will stick”–www.logisticsmgmt.com 07/02/13
- “Ocean cargo shippers may get break on spot charter rates”– www.logisticsmgmt.com 07/03/13
