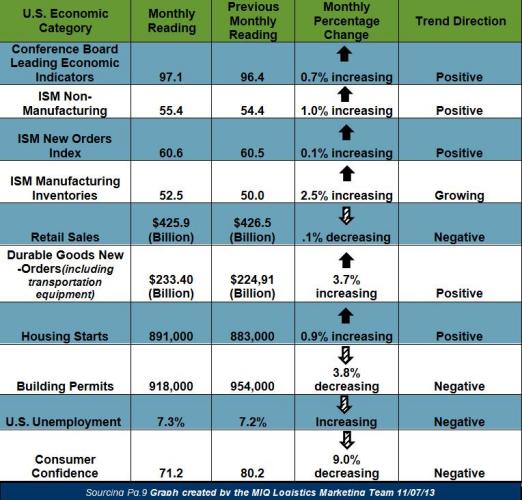
“The September LEI suggest the economy was expanding modestly and possibly gaining momentum before the government shutdown,” said Ken Goldstein, Economist at The Conference Board. “Beyond the immediate fallout of the shutdown, the biggest challenge is whether relatively weak consumer demand, pinned down by weak wage growth and low levels of confidence, will recover during the final stretch of 2013 and into 2014.”
Institute for Supply Management (ISM) Manufacturing Report on Business
Economic activity in the manufacturing sector increased again in October
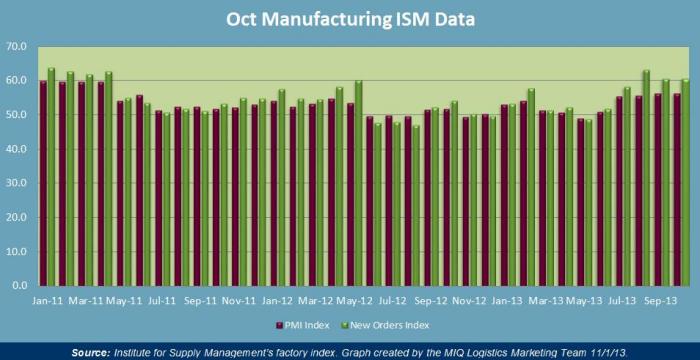
- 50 represents the dividing line between expansion and contraction for the index of the below chart; which covers the Purchasing Managers Index (PMI) and new orders.
- The PMI reading increased to 56.4% in October, which is 0.2 percentage points higher than the reading in September, which had been 56.2%.
- New Orders increased in October by 0.1%, which raised the reading to 60.6%.

- Textile Mills
- Food, Beverage & Tobacco Products
- Furniture & Related Products
- Printing & Related Support Activities
- Electrical Equipment Appliances / Components
- Computer & Electronic Products
- Transportation Equipment
- Petroleum & Coal Products
- Wood Products
- Plastics & Rubber Products
- Nonmetallic Mineral Products
- Machinery
- Paper Products
- Fabricated Metal Products
Contracting Manufacturing Industries
- Apparel, Leather & Allied Products
- Primary Metals
- Chemical Products
- Miscellaneous Manufacturing
U.S. GDP

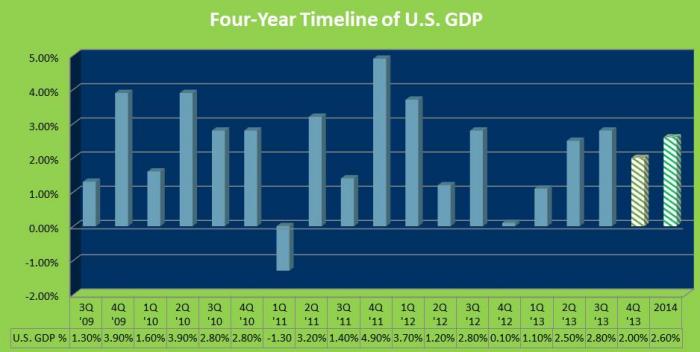
- 3rd quarter U.S. GDP rose at 2.8% (annualized rate/advance estimate) after a 2.5% growth rate in 2nd quarter of 2013.
- From a recent Bloomberg survey (Oct. 31st): U.S. GDP growth is projected to be less in the 4th quarter with survey results coming in at 2% rather than the original forecast of 2.4% (original forecast was from a Oct. 4 – 9 survey.)
- From a recent report from the IMF (Intl. Monetary Fund) the U.S. will improve to an average of 2.6% GDP growth in 2014.
Transportation Market Update
| Transportation Index Category | Monthly Reading | Previous Monthly Reading | Trend Direction |
| American Trucking Association (SA) seasonally adjusted For-Hire Truck tonnage | 128.7 | 126.9 | + 1.4% increasing |
| Cass Freight Index Report (Shipments) | 1.116 | 1.156 | – 3.5% decreasing |
| Cass Freight Index Report (Expenditures) | 2.508 | 2.575 | – 2.6% decreasing |
| Freight Transportation Services Index | unreported | 114.8 | unreported |
| Trucking Employment | + 400 jobs | + 400 jobs | Positive |
| 59% of the $96.5 Billion of U.S.-NAFTA trade was transported by truck in August; this is up 2% YOY | NAFTA Statistics for August | ||
- “I continue to be pleasantly surprised on the strength of truck tonnage,” ATA Chief Economist Bob Costello said. “I attribute a part of tonnage’s robustness to the sectors of the economy that are growing fastest, like housing construction, auto production, and energy output. These industries produce heavier than average freight, which leads to faster growth in tonnage versus a load or shipment measure.”
- “While tonnage is likely running ahead of overall economic growth, perhaps the economy is stronger than many believe. The index has now increased in four of the last five months and the year-over-year growth rate has accelerated. Plus, other measures of truck freight volumes, while increasing at a slower pace than tonnage, have also accelerated in recent months,” he said. “However, the government shutdown served as a headwind in the fourth quarter.”
- “Retailers witnessed a solid sales performance in September, with marked gains in all sectors, excluding clothing. The American consumer remains ever-cautious and value-driven but continues to spend. Only time will tell if and when the government shutdown and debt ceiling debacle will impact retailers and consumers this fall and winter. The true economic impact of Washington’s inability to enact policies that enhance and sustain economic growth and certainty remains to be seen.” – NRF President and CEO Matthew Shay
Global Market Update
Recent Statements from National Retail Federation and Hackett Associates
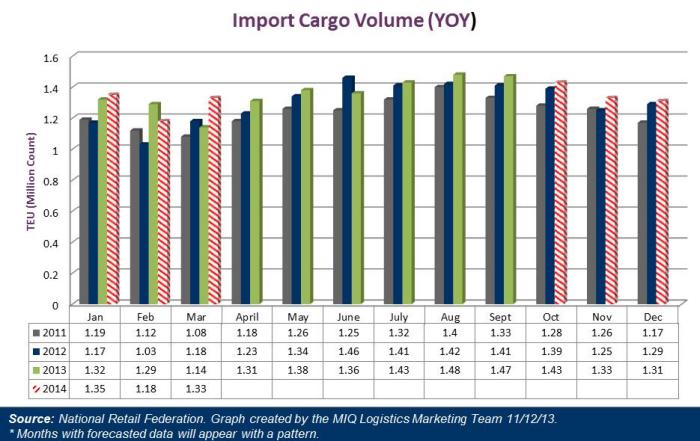
- The U.S. import TEU forecast is now expected to hit 16.2 million TEU, which is a lower adjustment from the October forecast of 16.3 million TEU.
- This downward adjustment will leave U.S. TEU Imports at a 2.3% YOY increase over 2012.
- “Retailers place their orders for merchandise months ahead of time, so cargo arriving at the ports in October and for most of the rest of the year was ordered long before anybody ever heard of a shutdown,” Vice President for Supply Chain and Customs Policy Jonathan Gold said. “The question at this point isn’t how much merchandise arrived but how much consumers bought, and how they are going to react as economic talks continue in Washington. Lawmakers need to take steps that build confidence, not continue the uncertainty.

Transpacific Eastbound
*NOTE: The ocean carriers final GRI is pending, but several carriers plan on implementing a $100.00 mitigation on U.S. West Coast, a $200.00 mitigation on U.S. East Coast, whereas IPI the carriers plan on passing at full announced levels and some lanes may witness a $100.00 Mitigation.

Announced Transpacific Eastbound GRI Levels – Effective 11/15/13
| Container Type | 20′ | 40′ | 40′ HC | 45″ |
|---|---|---|---|---|
| TPEB Lanes to West Coast | $320.00 | $400.00 | $450.00 | $506.00 |
| TPEB to East & Gulf Coast | $320.00 | $400.00 | $450.00 | $506.00 |
| TPEB to Inland Points | $320.00 | $400.00 | $450.00 | $506.00 |
4Q13 Transpacific Eastbound Bunker Levels Announced – Effective 10/1/13 – 12/31/13
| Container Type | 20′ | 40′ | 40′ HC | 45′ |
| TPEB Lanes to West Coast | $424.00 | $530.00 | $596.00 | $671.00 |
| TPEB to East & Gulf Coast | $780.00 | $975.00 | $1097.00 | $1234.00 |
| TPEB to Inland Points | $706.00 | $883.00 | $993.00 | $1118.00 |
SOURCES
Domestic & Global Economy
- “The Conference Board Leading Economic Index (LEI) for the U.S. Increased in September”– www.conference-board.org11/06/13
- “October 2013 Manufacturing ISM Report on Business”– www.ism.ws 11/01/13
- “October 2013 Non-Manufacturing ISM Report on Business”– www.ism.ws 11/05/13
- “Employment Situation Summary”– www.bls.gov 11/08/13
- “Broad Gains Seen in Retail Sales This September” – www.nrf.com 10/29/13
- “Advance Monthly Sales for Retail and Food Services September 2013”– www.census.gov 10/25/13
- “U.S. Durable Goods Increase on Aircraft Demand”– www.bloomberg.com 10/25/13
- “Advance Report on Durable Goods Manufacturers’ Shipments, Inventories and Orders September 2013”– www.census.gov 10/25/13
- “New Residential Construction In August 2013”– www.census.gov 09/18/13
- “Consumer Confidence Decreases Sharply in October”– www.conference-board.org 10/29/13
- “Economy in U.S. Expands at a 2.8% Rate on Inventories”–www.bloomberg.com 11/07/13
- “National Income and Product Accounts Gross Domestic Product, 3rd Quarter 2013 (Advance Estimate)”– www.bea.gov 11/07/13
Truckload Capacity & Volumes
- “Cass Freight Index Report”– www.cassinfo.com – Oct 2013
- “September retail sales numbers are mixed according to Commerce and NRF data”– www.logisticsmgmt.com 10/29/13
- “ATA Truck Tonnage Index Jumped 1.4% in September”– www.truckline.com 10/22/13
- “Unemployment Rises to 7.3%, trucking gains 400 jobs”– ww.thetrucker.com 11/08/13
- “Three of Five Modes Carried More U.S. NAFTA Trade in August 2013 than in August 2012”– www.rita.dot.gov 11/07/13
