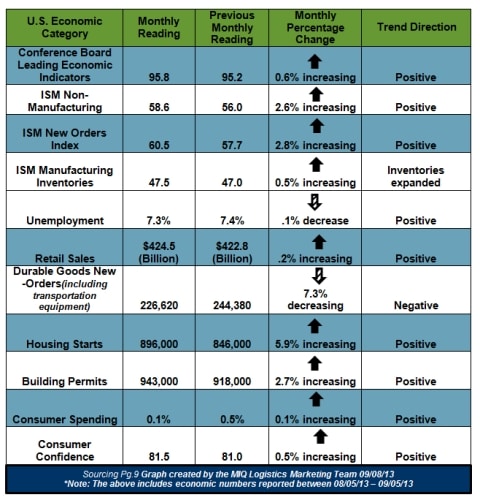
“Following moderate growth in the last few months, the U.S. LEI picked up in July, with widespread gains among its components. The pace of the LEI’s growth over the last six months has nearly doubled, pointing to a gradually strengthening expansion through the end of the year. In July, average workweek in manufacturing was the weakest component.”
– Ataman Ozyildirim Economist at the Conference Board

Institute for Supply Management (ISM) Manufacturing Report on Business
Economic activity in the manufacturing sector increased in August.
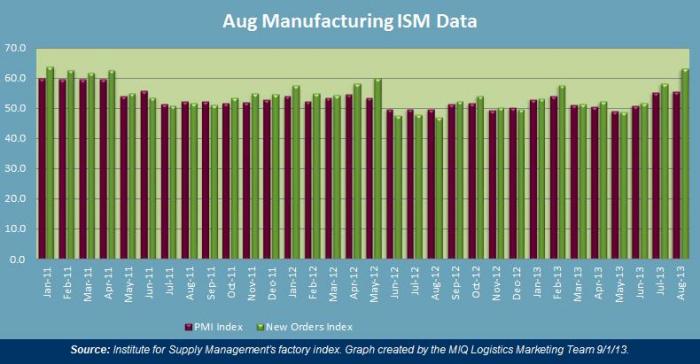
- 50 represents the dividing line between expansion and contraction for the index of the below chart; which covers the Purchasing Managers Index (PMI) and new orders.
- The PMI reading increased to 55.7% in August, which is 0.3 percentage points higher than July’s reading of 55.4%.
- New Orders increased in August by 4.9% to reach 63.2% on the index.

Expanding Manufacturing Industries
- Textile Mills
- Wood Products
- Electrical Equipment, Appliances & Components
- Food, Beverage & Tobacco Products
- Non-Metallic Mineral Products
- Plastics & Rubber Products
- Computer & Electronic Components
- Printing & Related Support Activities
- Furniture & Related Products
- Primary Metals
- Fabricated Metal Products
- Transportation Equipment
- Machinery
- Chemical Products
- Paper Products
Contracting Manufacturing Industries
- Miscellaneous Manufacturing
U.S. GDP

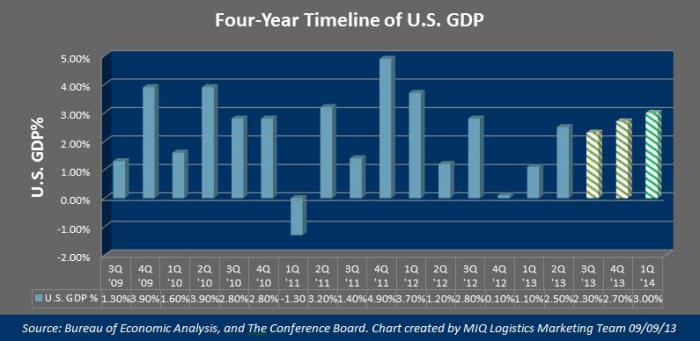
- On August 29th the Bureau of Economic Analysis (BEA) released their second quarter (second estimate) of U.S. GDP (real gross domestic product – the output of goods and services produced by labor and property located in the U.S.). The findings were that the U.S. GDP increased at an annual rate of 2.5% in the second quarter of 2013; this is up from the original estimate of 1.7%
- According to the BEA this increase in real GDP in the second quarter was attributed to “positive contributions from personal consumption expenditures (PCE), exports, private inventory investment, nonresidential fixed investment, and residential fixed investment that were partly offset by a negative contribution from federal government spending.”
- In a report from the IMF (International Monetary Fund) on July 9th, the forecast for U.S. growth is projected to rise 1 ¾ percent in 2013, and 2 ¾ percent in 2014. “The projections assume that the sequestration will remain in place until 2014, longer than previously projected, although the pace of fiscal consolidation will still slow. Private demand should remain solid, giving rising household wealth owing to the housing recovery, and still supportive financial conditions”.
- The Conference Board released an updated U.S. Economic Forecast on August 14th, with GDP projected for the next three quarters as 2.3%, 2.7%, and 3% respectively.
Transportation Market Update
| Truckload Index Category | Monthly Reading | Previous Monthly Reading | Trend Direction |
| American Trucking Association (SA) seasonally adjusted For-Hire Truck tonnage | 125.4 | 125.9 | – 0.4% decreasing |
| Cass Freight Index Report (Shipments) | 1.126 | 1.107 | – 2.3% decreasing |
| Cass Freight Index Report (Expenditures) | 2.448 | 2.484 | – 1.5% decreasing |
| Freight Transportation Services Index | 113.8 | 114.3 | – 1.2% decreasing |
| Trucking Employment | 0 jobs added | + 400 jobs | No Change |
- “After gaining a total of 2.2% in May and June, it isn’t surprising that tonnage slipped a little in July,” ATA Chief Economist Bob Costello said. “The decrease corresponds with the small decline in manufacturing output during July reported by the Federal Reserve last week.”
- “Despite the small reprieve in July, we expect solid tonnage numbers during the second half of the year as sectors that generate heavy freight, like oil and gas and autos, continue with robust growth,” Costello said. “Home construction generates a significant amount of tonnage, but as mortgage rates and home prices rise, growth in housing starts will decelerate slightly in the second half of the year, but still be a positive for truck freight volumes. Tonnage gains in the second half of the year are likely to overstate the strength in the economy as these heavy freight sectors continue to outperform the economy overall.”
Global Market Update
Recent Statements from National Retail Federation and Hackett Associates
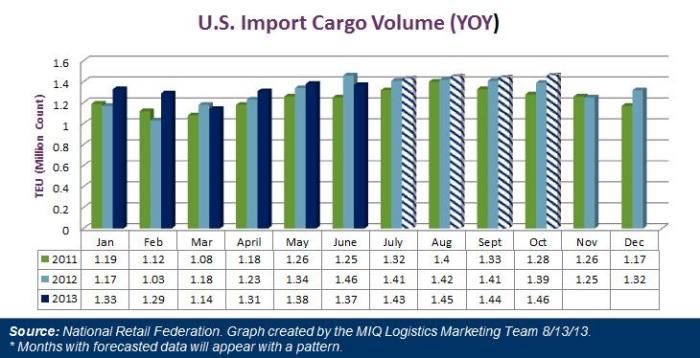
- “Merchants have been very cautious so far this year, but our forecast show that they plan to make up for it in the next few months,” – Jonathan Gold, NRF’s V.P. for Supply Chain and Customs Policy.
- “Ben Hackett, head of Hackett Associates, said trade activity at the ports has been tracking the slow-but-steady economic recovery in the United States. Hackett said, however, that is unclear if importers are now adding inventories ahead of expected holiday sales demand or to beat recently announced carrier rate increases heading into the peak shipping period.”

Transpacific Eastbound
4Q13 TPEB Bunker Levels Announced: Effective 10/1/13-12/31/13
| Container Type | 20′ | 40′ | 40′ HC | 45″ |
|---|---|---|---|---|
| TPEB Lanes to West Coast | $424.00 | $530.00 | $596.00 | $671.00 |
| TPEB to East & Gulf Coast | $780.00 | $975.00 | $1097.00 | $1234.00 |
| TPEB to Inland Points | $706.00 | $883.00 | $993.00 | $1118.00 |
*Note: There is a possible 10/15/13 TPEB GRI that MIQ Logistics is monitoring.
Transpacific Westbound
- “Ocean cargo carriers comprising the Transpacific Stabilization Agreement (TSA) Westbound section contend that there is an “urgent need” to begin rate restoration efforts in anticipation of fourth quarter cargo growth”
- “Member carriers have announced plans to raise freight rates, for all commodities and from all U.S. origin points by at least $100.00 per 40-foot container (FEU) by no later than October 1, 2013”.
SOURCES
Domestic & Global Economy
- “Employment Situation Summary”– www.bls.gov 09/05/13
- “Aug 2013 Manufacturing ISM Report on Business”– www.ism.ws 09/01/13
- “Aug 2013 Non-Manufacturing ISM Report on Business”– www.ism.ws 09/05/13
- “U.S. Consumer Spending Up 0.1% in July”– www.reuters.com 08/30/13
- “Advance Monthly Sales For Retail And Food Service”– www.census.gov 08/13/13
- “Advance Report on Durable Goods Manufacturers’ Shipments, Inventories and Orders July 2013”– www.census.gov 08/26/13
- “New Residential Construction In July 2013”– www.census.gov 08/16/13
- “Conference Board Consumer Confidence Index Increases Slightly” – www.conference-board.org 08/27/13
- “The Conference Board Leading Economic Index”– www.conference-board.org 08/22/13
U.S. GDP Forecast
- “Short-Term Energy Outlook (STEO)” – www.eia.gov 07/09/13
- “The U.S. Economic Forecast”– www.conference-board.org 08/14/13
- “Gross Domestic Product, 2nd quarter 2013 (second estimate)”– www.bea.gov 08/29/13
- “IMF cuts growth forecast for U.S., world economies” – www.cbsnews.com 07/09/13
- “World Economic Outlook Update”– www.imf.org 07/09/13
Truckload Capacity & Volumes
- “Cass Freight Index Report”– www.cassinfo.com Aug 2013
- “BTS says Freight TSI is down 1.2 percent sequentially and up 1.4 percent annually”–www.logisticsmgmt.com 08/15/13
- “July tonnage is up annually, reports ATA”– www.logisticsmgmt.com 08/20/13
- “FTR’s June Trucking Conditions Index Shows Improvement”– www.truckinginfo.com 08/13/13
- “ATA Truck Tonnage Index Fell 0.4% in July”–www.truckline.com 08/20/13
- “Trucking jobs flat in August”– www.truckgauge.com 09/06/13
Global Market Update
- “Global Port Tracker report has optimistic outlook for rest of year and into 2014”– www.logisticsmgmt.com 09/06/13
- “Ocean shipping data indicates pick up in U.S. import demand during second half of year”– www.dcvelocity.com 08/13/13
- “Transpacific ocean cargo carriers declare rate hike”– www.logisticsmgmt.com 08/29/13
